Mandelbrot Fractal
Fractal Overview
One of the properties of any fractal set is that it appears similar at whatever scale it is displayed. The "magnification" given in each fractal pattern is the scale of that fractal. The larger the magnification, the smaller area the picture covers. Often magnifications can vary from 100 to 4,000,000 with the fractal image looking very similar (but never exactly the same) at each scale.
Mandelbrot Fractal
The Mandelbrot set is a collection of points in the complex (or XY) plane that obey a certain law. This set is named after Benoit Mandelbrot who worked with many different types of fractals, and wrote the book "The Fractal Geometry of Nature" about his discoveries.
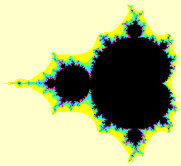
Only points near the origin of the complex plane can be in the set. For a description of the law see below. Here is a picture of the entire set.
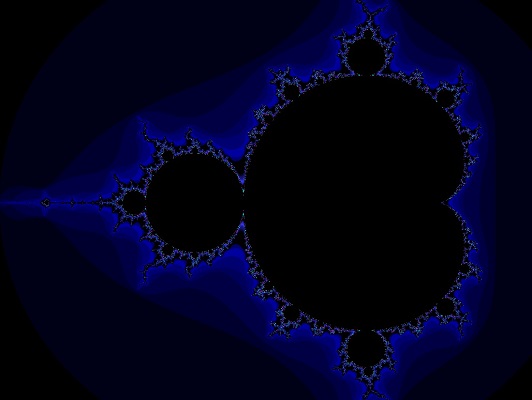
It is easy to compute if a certain point does not obey the law, but usually difficult (or impossible) to compute if the point does obey the law. All points that do obey the law are in the Mandelbrot set, and are colored (usually) black. All other points are given various other colors based on how close they come to obeying the law.
Usually darker colors are used for points that obey pretty well, but don't quite make it. Such points can be thought of as being on the "edge" of the set.
Lighter colors are used for points that are not as near. White is usually reserved for those points that don't even come close to obeying the law. These points are "far away" from the set.
Special computer programs allows areas of the complex plane to be viewed on the screen. Each point within the chosen area is assigned a number according to the Mandelbrot formula. The larger the number, the closer the point comes to the "edge" of the set. These numbers take a lot of CPU time to calculate. Once calculated, the numbers can be saved for quick reference later. Once the numbers for points are saved, the points can be displayed with various color schemes.
Mathematical topics
The area to be displayed is a rectangle in the complex plane. Each pixel on the screen (or stitch in a needlepoint) is mapped to a complex coordinate:
p = x + iy
Where p is a complex number. Any point p0 can be plugged into a formula that computes a new point. The formula for the (n+1)st point given the (n)th point is:p(n+1) = p(n) * p(n) + p0
Where p0 is the original starting point, complex multiplication and addition are used. This formula is used over and over again with the result of each iteration being plugged back into the same formula using the original p0. Each starting point will thus determine a sequence of new points in the complex plane. That is: for each p0, there is a different sequence of points p1, p2, p3, ... p(n), p(n+1), ... and so on to infinity.
The way this formula works, once a point in the sequence gets far enough away from the origin, all of the rest of the points will be even further away.
Any point in the Mandelbrot set obeys the following 4 laws:
- The sequence of points as calculated above starting from the given point always stays near the origin.
- A point is not in the Mandelbrot set if its sequence of points as defined above runs away from the origin.
- The number of times the above formula must be applied before the sequence of points starts to run away from the origin is that number assigned to the point by the computer program.
- This number indirectly determines the color of the point.
You can see that it is easy to tell if a point is not in the Mandelbrot set, because after so many iterations of the formula the points start running away from the origin. The computer then stops the sequence and assigns that number to the point.
For points in the Mandelbrot set, the sequence of points never goes far from the origin. To allow an approximate display, the computer stops counting after hitting a user supplied limit. This limit is in some sence a resolution. For smaller areas very near to the edge of the set, it must be set larger than for those areas farther from the edge.
Colors
Once the numbers have all been calculated, there is a rectangular grid of numbers. Each point in the grid (or stitch in the needlepoint) has its own number. These numbers range from 1 up to the cutoff limit used during the calculations. Points that have the limit number are either in the set, or so close to it that makes no difference.
Usually the points with the lowest numbers are colored black, or a dark color because they are far away from the set. Also, points with the limit number are colored black because they are in the set.
The fun comes with numbers in between. Basically, a color is assigned to a range of numbers. As an example: All points with a number in the range 21..55 are a shade of green. All points with a number in the range 56..107 are a shade of yellow. All points with a number in the range 108..156 are a shade of orange. Etc. Inside each range, the color assigned can vary in lightness or darkness.
You can see that the same set of points with the same set of numbers can look very different depending on how the colors are assigned to the numbers. The trick is to look for natural ranges in the numbers and pick pleasing colors.
Projects
Fractals are the ultimate high resolution pictures. No matter how high of a resolution you use to look at them, there are always details that blur, and are left out. At first I thought this made them un-suitable for crude low resolution needlepoint designs. Then I thought, why not give it a try? I was surprised by the results.
Here are some fractal images I have made:


Here are needlepoint pieces based on fractals:


Here are some videos based on fractals: